Technical concepts
Reading a candlestick: what the body and the wick actually say
Four numbers, one shape. A careful look at what a single candle does and does not tell you.
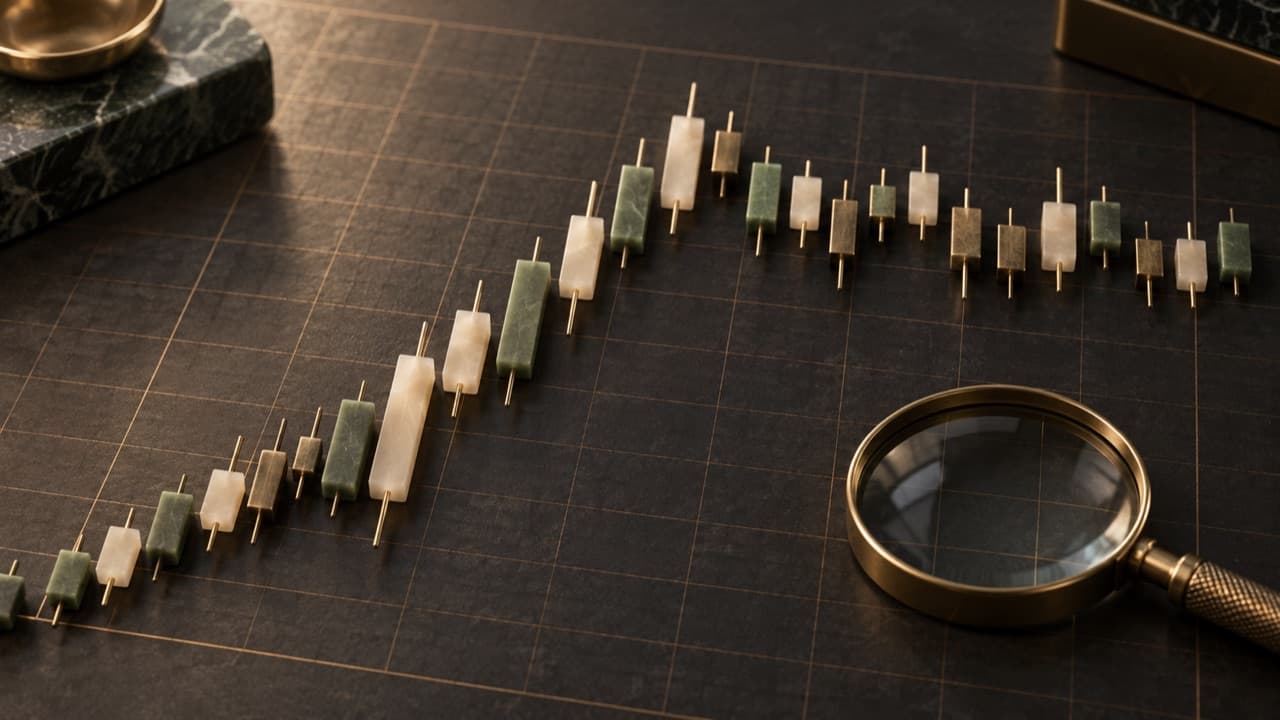
A candlestick compresses a period of trading into four numbers: the open, the high, the low and the close. The shape is only a way of drawing them.
The body
The thick part, the body, spans the open and the close. A long body means price travelled a long way between the start and the end of the period. A short body means the two were close together. On this site a green outline means the close finished above the open (bullish) and a red outline means it finished below (bearish). Platforms differ, so always check the legend.
A candle in plain numbers
Imagine an invented period with open 100, high 108, low 97 and close 105. The body connects 100 to 105. The upper wick reaches 108 and the lower wick reaches 97. The candle does not reveal the order in which those extremes happened, or how easy it would have been to trade at them.
Two periods can share these four values while containing different paths inside them. A candle is a summary, not a recording of every transaction.
The wicks
The thin lines are the wicks. The upper wick reaches the period’s high and the lower wick its low. A long wick tells you price went somewhere and was pushed back. It does not tell you why.
What one candle cannot tell you
- It says nothing about what the next candle will do.
- Its meaning depends on context: the trend before it, nearby zones, and the timeframe.
- Patterns with names are descriptions of past behaviour, not guarantees.
A habit worth building
Before labelling a candle, describe it in plain words: where it opened, how far it travelled, where it closed relative to its range. Then ask what the surrounding candles say. Reading comes first. Conclusions come last.
Try the description before the pattern name
Choose three historical candles on the same timeframe. For each one, write whether the close is above or below the open, where it sits inside the full range and what the wicks add to the description. Then use the interactive candle to compare a bullish and a bearish example.
Keep the later chart hidden. If your sentence says “so price will rise next,” separate that prediction from the four prices you actually observed.
Educational content only. Trading involves substantial risk of loss. See the full disclaimer.
All insightsKeep exploring